
 0
0
 0
0
By Kelvin Yuk
Description of Antenna Testing
A detailed block diagram of the test setup illustrating the signal path is shown in Figure 1.

Figure 1. Test setup block diagram
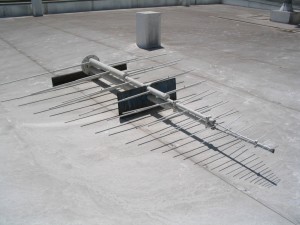
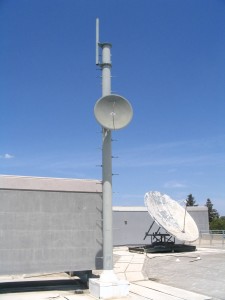
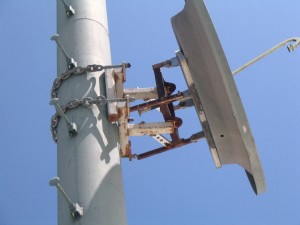
A photograph of the antenna setup is shown in Figure 2.

Figure 2. Test setup photograph
The antenna range was set up on the roof of Kemper Hall. A vertically-oriented biconical antenna serves as the transmitting antenna. The four element dipole antenna serves as the antenna under test. The transmit and receive antennas are positioned approximately 21 ft apart. An effort was made to position the antennas away from adjacent railing fixtures on the roof. The center of the biconical antenna and the four element dipole stands approximately 9’8” feet above the roof’s surface.
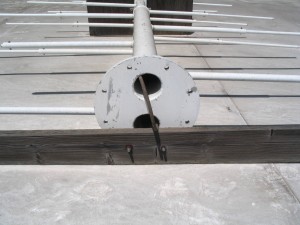
The antenna pattern of each dipole was individually tested over 360 degrees with the other three terminated with Type F 75 ohm terminations (Radio Shack 15-1156 terminations, Radio Shack 278-304 couplers). The four element dipole antenna with center mast was strapped to a wooden stand and then mounted to a rotator. The rotator is used to control the angle of the antenna element under test relative to the transmit antenna. The rotor also outputs a voltage proportional to the angular position of the rotator.
The PNA serves as the signal generator, measurement instrument and instrument controller for the computer-controlled semi-automated test setup. The synthesizer in the PNA generates a signal out of port 1 at fo=164.5MHz. In the experimental data provided in this document, a -75dBm power level is used. The signal is then amplified using the Boonton Power Amplifier which has +32.76dB gain at fo. This makes the resulting available transmit power equal to -42.24dBm. This signal is sent to the biconical antenna and then transmitted into the air.
The four element dipole antenna receives the signal which drives the pre-selector input. The preselector (biased at 12V) amplifies the received signal by +16.33dB. That amplified signal is measured at port 2 of the network analyzer. At the same time, a digital multimeter records the position-proportional output voltage from the rotator control box. The system controller stores the position voltage and received signal into a spreadsheet.
The process is repeated for other angles as the rotator rotates the four element dipole antenna under test until an entire pattern is recorded over 360 degrees.
Operation of the pattern measurement setup is conducted as follows:
1. The particular dipole under test of the four element dipole array is manually aligned broadside with the transmitting biconical antenna.
2. The rotator control is initiated in the clockwise direction which rotates the entire four element dipole in the clockwise direction at a constant rotational speed.
3. As soon as the rotation of the antenna begins, the data acquisition program is initiated.
4. The PNA continuously transmits the fo signal at port 1 through the power amplifier to the biconical antenna.
5. The received power at port 2 and the output voltage of the rotator is sampled at 1 second intervals and collected into an array by the acquisition program.
6. After a complete rotation of 360 degrees, the data acquisition is halted and the recorded data is stored in an Excel spreadsheet.
7. The position of the antenna is reset back to the broadside orientation by setting the rotator in the counterclockwise direction.
8. The entire four element dipole array and mast is unfastened from the rotator plate, manually rotated such that the next desired dipole under test is oriented broadside with the transmitting biconical antenna and refastened to the rotator plate.
9. The new dipole under test is connected to the preselector input and the previous dipole under test is terminated with the 75 ohm termination.
10. Steps 1-9 are repeated for all remaining dipoles of the four element array antenna.
Antenna Pattern Measurement Results
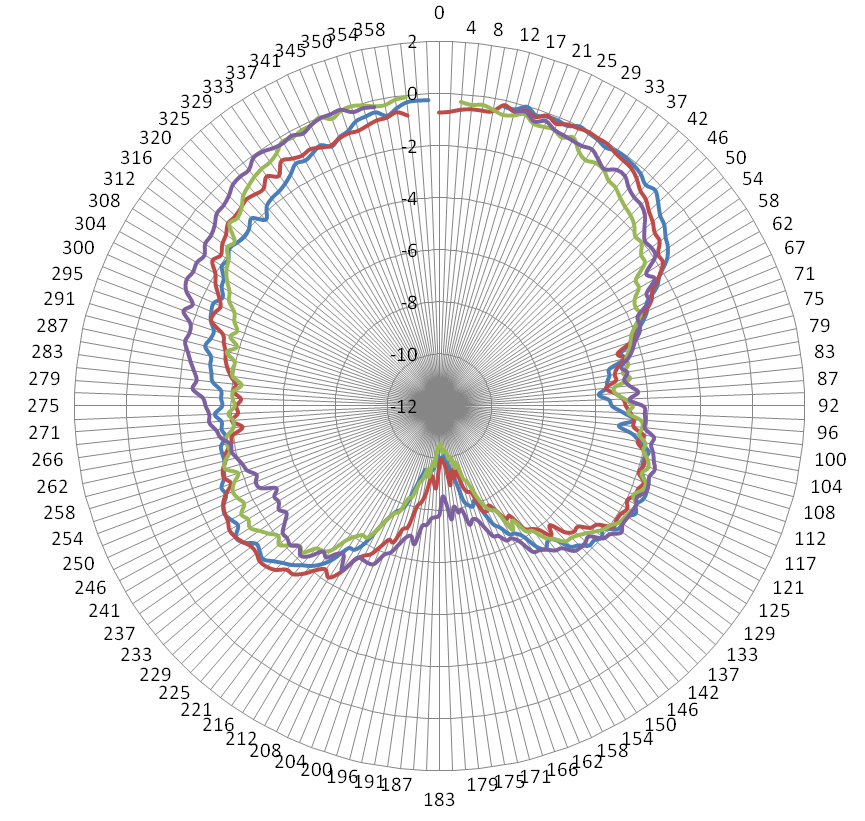
The antenna patterns of each of the four elements of the antenna array are plotted on a Cartesian axis as shown in Figure 3. The same sets of data are plotted on a radial plot shown in Figure 4. The results presented are the best that we have been able to produce thus far.

Figure 3. Measured patterns of individual elements of four element dipole antenna (Cartesian)
As stated previously, the PNA synthesizer power is set to -75dBm. Due to the low synthesizer power setting, averaging was used to improve signal to noise ratio of the responses. An averaging factor of 10 at a sweep time of 90 microseconds was used. The same preselector (Preselector A) was used in the testing of the four dipoles.
Preselector discussion
The two-port S-parameters of the four preselectors were measured on the PNA to verify the performance of each one. For each preselector under test, the unit was biased at 12V while the other adjacent preselectors remained off during the measurement. The performance summary is tabulated in Table 1.
Table 1. Preselector performance summary
| Preselector | VSWR1 | VSWR (ideal 75Ω) | Actual Zin1 (Ω) | VSWR2 | VSWR (ideal 50Ω) | Actual Zin2 (Ω) | Gain 21 (dB) |
| A | 3.68 | 1.50 | 183.80 | 2.95 | 1.00 | 147.65 | 16.327 |
| B | 2.89 | 1.50 | 144.70 | 4.19 | 1.00 | 209.70 | 18.241 |
| C | 4.61 | 1.50 | 230.25 | 2.95 | 1.00 | 147.65 | 13.574 |
| D | 4.85 | 1.50 | 242.30 | 3.26 | 1.00 | 162.90 | 12.946 |
The resulting data show that the input impedance of the preselectors ranges from 144 to 242 ohms. Due to the ~70 ohm impedance of the dipole antenna, this mismatch at the preselector input may lead to a reduction of the power available to the preselector as well as the possibility for reflections. This may pose a problem when the preselector is used during the antenna measurement since reflection from the pre-selector input and re-radiation from the antenna under test is possible. The output impedances of the preselectors range from 147 to 209 ohms. This mismatched preselector output impedance may cause an inefficient delivery of power to the PNA’s 50 ohm terminal impedance. Finally, the gain of the preselectors range from 12.95dB to 18.24dB. The variation in gain between the preselector units may cause substantial mismatch when all are used together to receive signals from the four dipole elements in the antenna array.
Questions and Recommendations
1. May we obtain the numbers for the computed pattern simulation (NEC simulation) of the four element dipole antenna?
2. In the preselector unit, we have noticed that the biasing network at the preselector output has been removed. Can this be left intact for future preselector units? This would simplify our biasing scheme and eliminate the need for external wiring.
3. An improvement on the alignment and symmetry of the four element dipole is recommended. If someone can come to the Kemper Hall roof to precisely align and glue down the pieces of the four element dipole, it will reduce the amount of variability in our measurement.
4. An increase in the height of the both the four element dipole antenna and the transmitting biconical antenna is recommended. Additional PVC piping for the higher positioning of the biconical antenna is needed.